Search this Blog

Wednesday, March 31, 2010


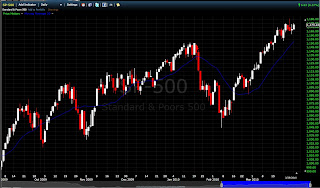
The market ended a great first quarter in a range, between resistance at 1180 and support at 1160, very low volume the last couple of days, didn't help either.
Historically the day before Good Friday holiday is bullish plus the first day of the month too, we'll see as oscillators look tired and the MACD histogram turned negative as well.

Wisdom

“Every once in a while you must go to cash, take a break, take a vacation.
Don’t try to play the market all the time. It can’t be done, too tough on the emotions.” – Jesse Livermore

S&P at Resistance


The S&P has attempted several times to break thru 1180 and seems to be having a hard time. I think it's best to be very cautios or be very nimble here if you want to play the short side. 1150 is very strong support for the SPX and pullbacks there would likely see some solid bounce. I have been watching several stocks turning deeper into the red but the indexes are only down slightly. Everyone is expecting the market to turn, but that could be the reason why it keeps churning up.

Tuesday, March 30, 2010

An Old Reliable SPY Setup


SPY pulled back for the 3rd day in a row on Friday. The action also qualified it for the study.

"Rate of decline" simply refers to the fact that the losses have been smaller each of the last 2 days on a percentage basis.

Unfortunately the study is not being confirmed by the SPX, which closed up slightly on Friday. It will be interesting to see how it turns out, but I've discounted the study in this instance due to the SPX non-confirmation.

Bullish & Bearish Factors


Interesting post from the Kirk report.

While many times market activity cannot and should not be entirely explained and understood in relation to simple news events (Mr. Market is far more complex), here’s a listing of the most significant bullish & bearish factors, news-focused resources indicate that we’ve seen over the past couple of weeks:

Bullish Factors:

•Unexpected increase in retail sales

•Analyst predictions for expanding U.S. payrolls

•Slack inflation pressures reported in both CPI & PPI

•Fed promises that interest rates will remain “exceptionally low” for an “extended period”

•Analysts raise earnings & profit forecasts

•Reduced sovereign debt concerns especially over Greece

•Increasing dividend payouts

•Very positive comments about the recovery from executives like the CEO of Fedex

•Barton Biggs predicts another 10% gain due to performance pressure by underinvested fund managers

•Richard Bove said bank stocks may quadruple over the next two to three years as loan defaults decrease

•Fedspeak from Bullard who sees significant jobs improvement

•Better than expected economic reports ranging from durable goods to a larger decline in weekly initial unemployment claims

•Increase in Q4 US corporate profits by $108.7 billion to $1.47 trillion as earnings surged +31% from the same period in 2008

•Prediction from the WTO that global commerce will grow by +9.5% this year from last year fueled by growth in Asia and India

•Prediction from Birinyi Associates that the S&P 500 Index will climb to 1,325 by year-end

•Euro-Zone economic confidence surged

•Companies in the S&P 500 Index spent $47.8 billion on stock buybacks during Q4 of 2009 which is up +37%

•New government programs to help US homeowners avoid foreclosure

•Better housing market as smaller-than-expected decrease in existing home sales

•Chipmakers see signs of increased demand

•Signs of a bottom in U.S. commercial property as values rose 1%

•Strength in health-care companies due to health care reform

•US is unlikely to lose its top AAA credit rating

Bearish Factors:

•Concern that stock prices are overextended

•Concern that China’s economy may slow and crimp the global economy after China’s Premier Wen Jiabao said that ballooning sovereign debt and high unemployment worldwide could send the global economy into a “double dip” slump

•Prediction from Morgan Stanley that it expects “multiple” increases in China’s bank-reserve ratio requirements and higher interest rates in China as early as next month

•Weakened foreign demand for US equities after net foreign purchases of US stocks dropped -79%

•Decrease in the March NAHB housing market index which matched an 11-month low

•The unexpected decline in March US University of Michigan consumer confidence

•A decrease in the safe-haven demand for Treasuries

•Jump in yield on the 10-year T-note which raises the cost of capital for consumers and businesses

•Prediction from the Center for Global Energy Studies that crude prices will fall 25% to $60 a barrel in Q4 as OPEC members continue to disregard their quotas and overproduce

•Fed’s post-FOMC statement that reaffirmed it will end its asset-purchase program at the end of this month

•Prediction from economist Stiglitz that the Fed’s decision to stop purchasing mortgage-debt will drive up mortgage rates and worsen the housing crisis

•The unexpected action by the Reserve Bank of India to raise interest rates for the first time in almost two years

•Prediction from Brusuelas Analytics that the US unemployment rate will rise to 10.2% in Q3 and probably won’t fall below 9% until the end of next year

•Concerns that ever-increasing global debt levels may slow economic growth

•IMF said that advanced economies face “acute” challenges in tackling high public debt and that maintaining government debt at post-crisis levels might reduce growth in advanced economies by as much as half a percentage point

•The 312,000 surge in inventory of US existing homes for sale in February the biggest monthly increase in almost two years

•Prediction from Raymond James & Associates that the housing market “is in a fragile recovery that needs to see job growth to get a sustainable rebound”

•Comments from Geithner who said housing and the economy remain damaged and it will take “a long time” to repair the harm as the administration takes steps to overhaul industry financing and regulation

•Fitch Ratings cut Portugal’s credit rating to AA- from AA and keep its outlook on Portugal’s debt rating “negative,” which renews concern that Greece’s fiscal crisis will spread to other European countries and hamper a global recovery

•The unexpected decline in Feb US new home sales which fell to their lowest level since records began in 1963

•Prediction from ECB Governing Council member Wellink that the global economy could falter again before resuming its recovery as “private consumption and investments continue to decline or stagnate and this poses the risk that the economic recovery makes a false start and will be W-shaped”

•The unexpected downward revision to Q4 US GDP

•Data from the US Labor Department that showed unemployment rising in 27 US states last month suggesting that broad-based hiring has yet to develop

•Comments from Fed Governor Warsh who said the US faces “significant economic challenges”

•Geopolitical concerns after a South Korean naval vessel was sunk near the border of North Korea

•Weaker-than-expected US Feb personal income report which may signal a decrease in consumer spending in the months ahead

•Treasury said it plans to sell the government’s 27% stake in Citigroup this year using a “pre-arranged written trading plan”

Overall, I’d have to say that, at least in quick review, I don’t see anything here that is a tremendous surprise. I suppose in a small way that helps explain how calm the markets have been of late and why we remain below 20 in the VIX.

Monday, March 29, 2010

Energy stocks pushed the market higher


Oil prices rallied $3+ to 82.78 at the high of the day, before settling down at $82.18 The S&P ended up +6.63 at 1173.22, the trend is up and I won't fight it. The S&P 1200 is almost a reality as is the Dow at 11,000. Those numbers mean nothing, but phychologicaly looks like the market is going there, we'll see. Support is at 1167.71 and Resistance at 1174.85.
First quarter window dressing is still in effect. I am still bullish but watching the market for any reaction.

Sunday, March 28, 2010

Demand & Supply Momentum


Note that we've been seeing higher prices with successive pullbacks in momentum, the hallmark of a bull market. Price has held up well during the recent momentum retreat, leading me to believe that the bull market has not yet given up. That being said, we're not quite at momentum lows that have characterized recent intermediate-term buying opportunities.

Here's Why You Should Trade the S&P 500 E-Mini Futures

Whether you're new to the markets or a seasoned trader, you should be trading S&P 500E-Mini Futures.
Large Institutions and Hedge Funds trade S&P 500 Futures contracts. This way they leverage their money, not having to invest in any one company but actually able to trade all 500 at once. The S&P 500 E-mini Future is a smaller version of the exact same futures contracts traded by these large institutions. It is designed primarily for individual traders to trade.
But it follows along exactly with the larger S&P 500 the institutions trade. That way, when the large S&P 500 contract goes up, the E-Mini S&P 500 goes up along with it.
The E-mini S&P 500 Future offers great potential for traders. The margins for trading the E-mini S&P 500 Future contract can be as low as $400-$500 per contract, depending on the brokerage firm you use. But low margins are not the only reason traders are turning away from trading the Stock Market. So if you are tired of being in stocks "for the long haul", if you are tired of seeing your mutual fund portfolio value cut in half by the sub-prime credit crunch, find out why you should be trading S&P 500 E-mini Futures.
One of the best things about trading the S&P 500 E-mini Future is leverage. The S&P 500 E-mini Future is based upon the S&P 500 index, or the value of the top 500 stocks traded publically. Wouldn't it be great to be able to trade 500 stocks all at once, not having to research any one in particular? Unfortunately you cannot trade an index. So the Chicago Mercantile Exchange created a futures contract based upon this index. Instead of having to buy shares in 500 companies that would cost a fortune, you can pay $500 per contract. This way it is as if you are trading all 500 stocks at once. Now that is leverage. Leverage is probably the main attraction of professional traders to the futures market.
Another reason professional traders are attracted to trading the S&P 500 E-Mini Future is the ability to day trade. For $500 per contract, you can day trade. What could you buy for $500 if you were trading stocks? And many futures brokers will allow you to open an account with $2500. Day trading stocks makes you a "pattern day trader." The regulations required that you have a margin account of at least $25,000 in order to day trade stocks.
Not convinced yet? Look, here's another good reason to day trade the S&P 500 E-mini Future...no research.
You don't need to do hours and hours and hours of research just to find the stock to trade. No more investing hundreds of dollars monthly in a Real Time stock screener. And most important, no need to have 5 or 6 charts open at the same time.
You can use just one chart. This means you can concentrate on your technical set-ups on just one instrument. You won't need to open one chart, then minimize it, and then open another chart, etc. Trading just one instrument can often mean that you minimize risk because your attention is narrowed to just what you are trading.
As we know, each instrument trades differently, requiring its own profit targets and stop losses. Trading the S&P 500 E- mini future, you'll be able to identify profit targets and stop losses easier because you only need to set them for 1 instrument.
Much of trading is watching highs and lows, hard to do if you are watching a portfolio of 5 or 10 stocks. But if you only need to remember one closing price, one high or one low, might that not be easier to trade?
Whether you are a fundamental analyst or a technical analyst, the S&P 500 E-mini Future will work for you. With the institutional traders trading the larger S&P 500, you get the benefit of their research without the cost because you are trading the same basic instrument they are trading. Are you concerned with overbought or oversold conditions, news announcements, Federal Reserve interest rate cuts? The S&P 500 E-mini is a perfect tool for taking advantage of those specific movements. Why? Because the S&P 500 E-mini trades 24 hours a day.
Or are you a master chart technician? If so, the S&P 500 E-mini Future is for you. It works well with moving averages, Macd's, Stochastics, Pivots, and many other technical tools. If you prefer to look at the markets through a fundamental or sentiment-based approach, then rest assured that the same techniques for determining oversold markets or markets where emotions have run to extremes, will apply to e-mini index futures trading.

Saturday, March 27, 2010

Wisdom

"It can be very expensive to try to convince the markets you are right."
Ed Seykota, Market Wizards

Friday, March 26, 2010

Reversal continuation?


Today the market had a nice 9 point bounce to 1174, before selling off and breaking momentarily yesterday's support at 1165. In the afternoon trading buyers pushed the index back up to 1166.90 to close above support. My only concern is that in the last two days the market pullback have been with much more volume than the rally. End of the quarter is on Wednesday and institutional window dressing could keep the market from falling further. 1150 is the 20 day moving average which should provide strong support for a bounce if the market get's there.

Thursday, March 25, 2010

Reversal


The market pushed to new highs at 1180.70 into very overbought territory, before reversing hard and giving back all today's gains, stopping at support around 1165.

Tomorrow's opening will tell, if 1165 support is broken, the bears could take the lead then and we should follow the trend down until a new signal is broken.

An inverted hammer is clearly seen on the daily chart.